Data and Solutions

Windographer 5

Windographer 5 has been re-engineered from the ground up to provide you with better performance and more powerful tools. This long-awaited release is just the beginning of a new and more robust Windographer platform. Try out Windographer 5 today.

Download Now
Windographer just made a big leap! Try out Windographer 5 today.
Try 2 Weeks for Free

Access Data Quickly

See how Windographer 5 can simplify your life.

Analyze multiple datasets together

Instead of focusing on one dataset at a time, build a single workbook to contain all of your related datasets.
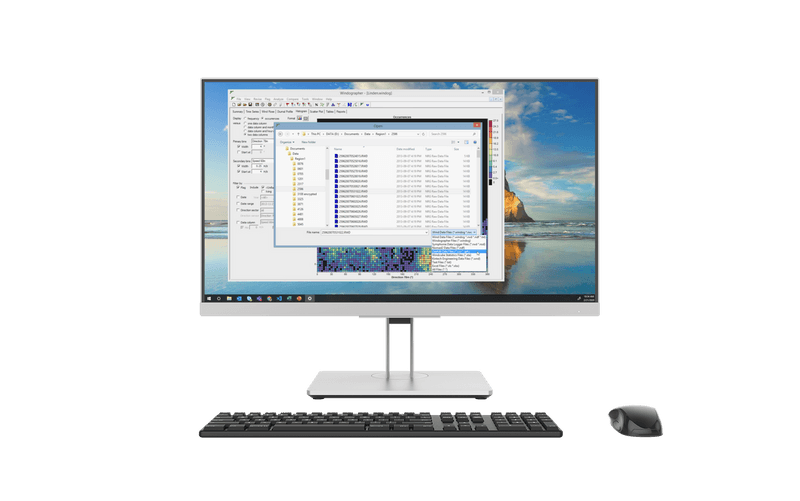
Import all kinds of data

Windographer reads virtually all data formats common to the wind power industry.

Multiple windows simultaneously

Keep your eye on multiple visualization modules while you make any modification.

Combine multiple data files

The File > Append process adds data from one or more data files to an existing data set.

Undo any modification

If you make a mistake like deleting the wrong data or executing the wrong flag rule, a multi-level undo system lets you restore your data, even days or months afterwards.

Manage larger datasets

Now a 64-bit application, Windographer 5 can handle much larger quantities of data.

Wind roses

Create many types of wind roses, including frequency by direction, mean value of any data column by direction, total wind energy by direction, and even polar scatterplots.

Import high-frequency data

Windographer 5 can read one-second data and even smaller time steps.

Flexible

New subscription model

We now offer Windographer via subscription only. This new approach means you will always have access to the latest version of software. It also frees our developers to release improvements to the software as soon as they are ready instead of holding them for the next major release. This will provide your team with the ability to continuously integrate the latest technology into your workflow.

Smart

Flag data segments based on visual inspection

By simply clicking and dragging on a time series graph or a scatter plot, you can manually apply flags to data segments to identify problems such as sensor malfunctions or icing events. Once you have applied flags, you can use those flags to filter data from graphs and calculations.

Adjustable

Measure-correlate-predict

The powerful new MCP module lets you compare and correlate with reference data, experiment with different time steps of comparison, solve for the optimal time offset, choose among several correlation algorithms, test which algorithm works best on your data, and compare your target data before and after the MCP process. Download long-term reference data for free.

Compare Editions

Can't decide which Editions to pick? We'll help you find the best pick.

Professional

Advanced analysis and automated quality control

Data Management

Reads and interprets a huge variety of data files: text, Excel, RLD, RWD, NDF, NSD, STA, WND

Allows appending of new data into an existing data set

Lets you define calculated data columns like ratios, shear exponent, or rotor-equivalent wind speed

Allows you to adjust calibration, combine colocated anemometers, and fill gaps

Extrapolates speed, turbulence, direction, and temperature data to any height

Tracks all modifications you make to the data set

Exports text files, TAB files, and formats required by Openwind, WindSim, Meteodyn WT

Produces standardized formatted reports, which you can save in PDF format

Analysis Features

Allows analysis of turbulence, wind shear, and tower distortion

Lets you define quality control flags and flag data manually based on visual inspection

Allows you to choose from a large library of wind turbines and to compare energy output

Advanced Analysis & Automation

Features an MCP module for correlating with reference data

Allows you to compare multiple data sets graphically

Allows you to automate data flagging using flag rules

Automatically detects and flags the effects of tower shading

Allows analysis of extreme winds , inflow angle, and long term trends

Allows free download of ERA5 and MERRA-2 data

Creates a representative year of hourly data with no gaps

Enterprise

Advanced data management

Everything in Professional, plus:

DataBase Features

Imports from and exports to any SQL database

Get in Touch

Let us know how we can help.

HELP AND SUPPORT

How can we help?

UL and the UL logo are trademarks of UL LLC © 2023. All rights reserved.